Maria Francesca Roig-Maimó1, I. Scott MacKenzie2 Cristina Manresa-Yee3Javier Varona4
En este trabajo se presenta el uso de una tarea de selección de objetivos en la evaluación de un head-tracker para dispositivos móviles. Primero, se describe el método de cálculo del rendimiento mediante un ejemplo detallado. A continuación, se discute el método de cálculo para tareas que no cumplen el estándar ISO. Debido a la amplitud no constante de la tarea dentro de cada secuencia, se calcula el rendimiento utilizando dos métodos de agregación de datos: por secuencia, calculando la amplitud media, y por condiciones comunes A-W. Se recomienda calcular el rendimiento utilizando la división de medias y el ajuste de precisión. La media general de rendimiento ha sido de 0,74 bps (un 45 % menor que con una tarea ISO). Se presentan dos recomendaciones de diseño para tareas que no cumplen el estándar ISO: mantener constantes A-W dentro de cada secuencia y utilizar estrategias para evitar el tiempo de reacción.
Palabras clave: Ley de Fitts, rendimiento, ISO 9241-411, HCI móvil, head-tracking
We used a target-selection task to evaluate head-tracking as an input method for mobile devices. First, the method of calculating Fitts’ throughput is described by means of a raw data detailed example. Then, the method of calculating throughput is discussed for non-ISO tasks, since the procedure targets were randomly positioned from trial to trial. Due to a non-constant amplitude within each sequence of trials, throughput was calculated using two methods of data aggregation: the first one, by sequence of trials using the mean amplitude, and the second one, by common A-W conditions.
For each data set, we used four methods for calculating throughput. The grand mean for throughput (calculated through the division of means and the adjustment for accuracy) was of 0.74 bps, which is 45 % lower than the value obtained using an ISO task. We recommend to calculate throughput using the division of means plus the adjustment for accuracy, and to avoid using the reciprocal slope of the regression model. We present various design recommendations for non-ISO tasks, such as: i) to keep amplitude and constant target within each sequence of trials, and ii) to use strategies to avoid or remove reaction time.
Key words: Fitts’ law, throughput, ISO 9241-411, mobile HCI, head-tracking.
Fitts’ law [1] describes the relationship between movement-time, movement-distance, and selection accuracy for people engaged in rapid-aimed movements. In Human-Computer Interaction (HCI), Fitts’ law applies to pointing and dragging using input devices. Since Fitts’ original publication, the law has proven one of the most robust, highly cited, and widely adopted models to emerge from experimental psychology [2].
Since 1954, when Fitts’ law was originally introduced, the model has been improved in primarily three ways: the model’s mathematical formulae, the accommodation of the distribution of movement end-points, and the means to calculate input device throughput. However these improvements were not universally adopted and as a result multiple variations of the law have been applied [3]. Inconsistency is a common problem that weakens study comparisons regarding throughput. As an effort to bring consistency, the ISO 9241-9 standard was published in 2002 [4]. ISO 9241-9 describes performance tests for evaluating human usage of non-keyboard input devices. The standard was updated in 2012 as ISO 9241-411 [5].[1] Despite standardization efforts, inconsistency in the calculation of throughput is still common in the HCI literature.
Within the mobile devices field, this inconsistency is even more problematic. It may not be suitable to use the tests described in the ISO standard, due to the particularities of small displays or to the motivation of the research. For this reason, researchers sometimes design custom Fitts’ law tasks. However, every costumed task brings its own challenges for calculating throughput, which may again lead to inconsistent values.
We present the “Face Me” experiment, which was not initially conceived for Fitts’ law analysis. The experiment used a non-ISO task and it was specifically designed according to the motivation of the study: testing target selection over the entire display surface using a novel head-tracking method. As the study involved point-select movements over a range of amplitudes and target widths, it may be possible to calculate throughput with the “Face Me” experiment data. We detailed the “Face Me” task and its challenges for calculating throughput, jointly with approaches to overcome these challenges.
The contribution of the present research is to identify situations where an empirical evaluation involving point-select tasks uses, by necessity and by design, tasks that do not make part of those described in the ISO 9241-411. We demonstrate how to calculate Fitts’ throughput –the dependent measure defined in ISO 9241-411– and identify potential problems that arise due to the task properties. This is followed with recommendations for designing non-ISO tasks to obtain valid and consistent throughput values.
2. Fitts’ law and the calculation of throughput
In the field of Human-Computer Interaction (HCI), Fitts’ law has been mainly applied in two ways: firstly as a predictive model, and secondly as a mean to derive the dependent measure throughput (Fitts’ index of performance) as part of the comparison and evaluation of pointing devices.
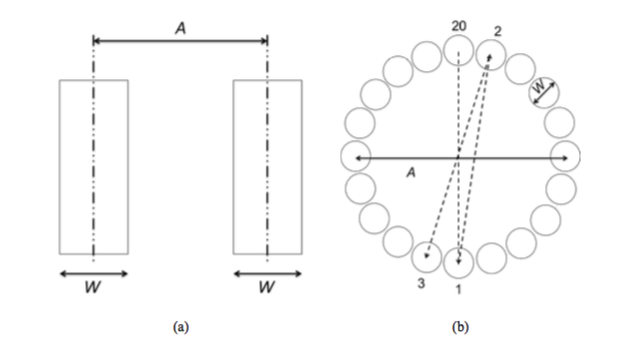
The calculation of throughput (TP) is performed over a range of movement amplitudes or distances and with a set of target widths that involves tasks in which computing devices are used. The primary tests in ISO 9241-411 involve point-select tasks using either one-dimensional (1D) or multi-directional (2D) tasks (see Figure 1). Although user performance is typically evaluated using multiple dependent variables (e.g., speed and accuracy), the only performance measure stipulated in the ISO standard is throughput.
Figure 1. ISO tests for pointing evaluation: (a) one-directional point-select test (b) multi-directional point-select test.
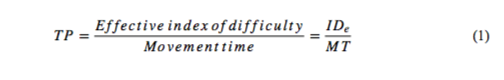
Throughput (TP) is calculated as follows:
where IDe is computed from the movement amplitude (A) and target width (W). MT is the per trial movement time averaged over a sequence of trials. Because IDe has units “bits” and MT has units “seconds”, the units for throughput are “bits per second” or “bps”.
The effective index of difficulty (IDe) is a measure of the difficulty and user precision when accomplishing a task:
where We is the effective target width calculated from the width of the distribution of selection coordinates made by a participant over a sequence of trials.
The effective target width is calculated as follows:
where Sx is the standard deviation of the selection coordinates towards the direction where the movement proceeds.
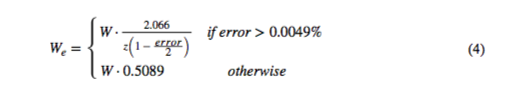
Alternately, if the standard deviation of the selection coordinates is unavailable, the error rate may be used to approximate the effective value,
where error is the error rate in the sequence of trials and z(x) is the inverse of the standard normal cumulative distribution; that is, the z-score corresponds to the point where the area under the normal curve is x% of 1. Assuming a normal distribution in the selection coordinates, We < W if the error rate < 4 % and We > W if the error rate > 4 %.
The effective value is used to include spatial variability in the calculation. The effective amplitude (Ae) can also be used if there is an overall tendency to overshoot or to undershoot [3]. Using the effective values, throughput is a single human performance measure that embeds both, speed and accuracy, in human responses. The index of difficulty calculated without the effective values (ID) quantifies the movement task that the experimenter wants subjects to perform; nonetheless, subjects often do not actually perform to the desire level of difficulty. The difference between ID and IDe is a natural consequence of motivated subjects’ desire to perform well. Thus, a large discrepancy may indicate that the movement tasks were extremely easy, extremely hard, or simply ill-suited to the conditions under investigation [3].
Despite standardization efforts, inconsistency in the calculation of throughput remains common in the HCI literature and this weakens the between-study comparisons. A point of particular contention is the interpretation of throughput as the slope reciprocal (1/b) from the regression equation. Although 1/b has units “bits per second” this term cannot be used as a dependent variable in experimental research because of the wavering influence of intercept, a, which is absent in 1/b. Throughput, calculated as 1/b, can be similar to the value calculated via Equation 1, only if the intercept (a) is 0 or close to 0. It is worthy to point out that Fitts originally defined throughput not as the slope reciprocal but as a division of means: “The average rate of information generated by a series of movements is the average information per movement divided by the time per movement” [1, p. 390]. A detailed description of the calculation of throughput is found in other sources [3], [6].
2.1 Demonstration of Fitts’ law analysis with an ISO task
In this section, we demonstrate how to calculate Fitts’ law throughput, using a subset of the data from an experiment that evaluates head-tracking interface. The calculation follows the ISO standard.
Twelve participants performed multi-directional point-select tasks across six target conditions: A = 260, 520, 1040 pixels crossed with W = 130, 260 pixels. The experiment was conducted using an iPad Air with a resolution of 2048 1536 px. The software implemented the ISO multi-directional tapping test (see Figure 1b). User input was combined with mobile head-tracking for the pointing action and for touch for selection.
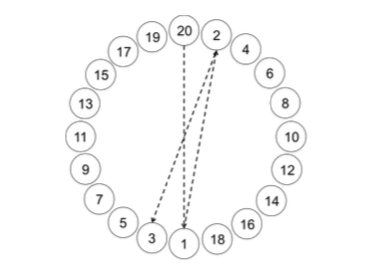
Each sequence consisted of 20 targets and each target was highlighted to be selected in the trial; therefore, a sequence of trials was composed by 21 selections (see Figure 2 and Table 1). Upon selection, a new target was highlighted. Selections proceeded in a pattern that was moving across and around the layout circle until all targets were selected.
Figure 2. ISO multi-directional point-select test of 20 targets. (Numbers added to identify targets).
Table 1. Corresponding trials for a ISO multi-directional point-select test of 20 targets. (See Figure 2 for target positions).
|
Trial |
Target |
Trial |
Target |
||
|
From |
To |
From |
To |
||
|
1 |
20 |
1 |
12 |
11 |
12 |
|
2 |
1 |
2 |
13 |
12 |
13 |
|
3 |
2 |
3 |
14 |
13 |
14 |
|
4 |
3 |
4 |
15 |
14 |
15 |
|
5 |
4 |
5 |
16 |
15 |
16 |
|
6 |
5 |
6 |
17 |
16 |
17 |
|
7 |
6 |
7 |
18 |
17 |
18 |
|
8 |
7 |
8 |
19 |
18 |
19 |
|
9 |
8 |
9 |
20 |
19 |
1 |
|
10 |
9 |
10 |
21 |
1 |
20 |
|
11 |
10 |
11 |
|
|
|
2.1.1 The Calculation of Throughput
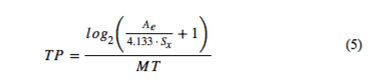
Using the effective values, throughput (TP) is calculated as follows:
where Sx is the standard deviation of selection coordinates towards the direction where the movement proceeds, MT is the mean movement time, and Ae is the mean of the actual movement amplitude in the sequence of trials.
The select position scatter data is used to perform the adjustment for accuracy for each subject and for each sequence. Therefore, the calculation of throughput requires Cartesian coordinate data for each trial for the starting position (“from”), the target position (“to”), and the select position (“select”).
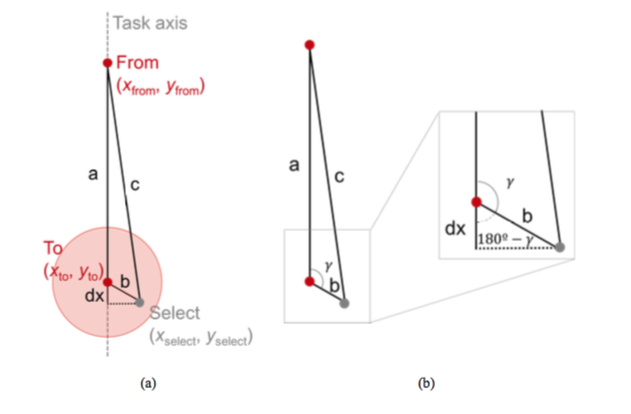
Figure 3a, shows the geometry for a trial. The actual movement amplitude corresponds to the movement distance for the trial projected on the task axis, i.e., a + dx. The selection coordinates in the direction that movement proceeds correspond to the distance . So, the calculation begins by computing the distance dx
Figure 3. Geometry for a trial.
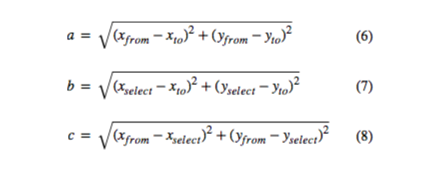
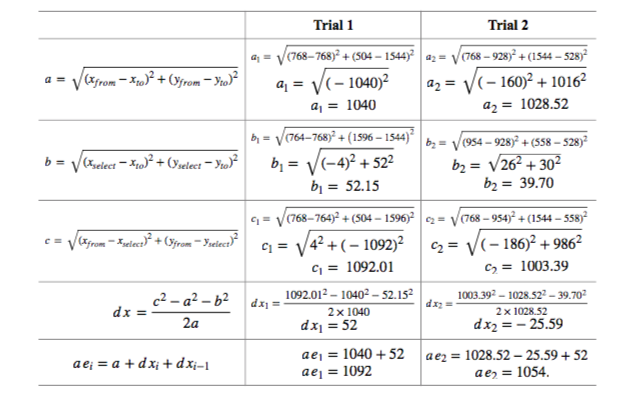
The values a, b, and c correspond to the length of the sides connecting from, to, and select points, which are calculated as follows:
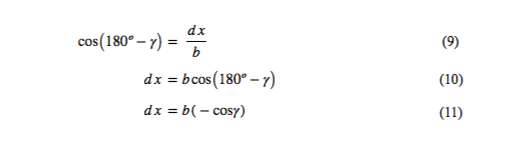
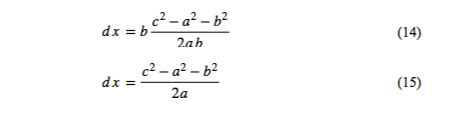
The value d x is defined by trigonometry as follows:
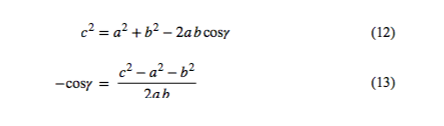
The value cosγ can be obtained by applying the law of cosines as follows:
Therefore, the value d x is calculated as follows:
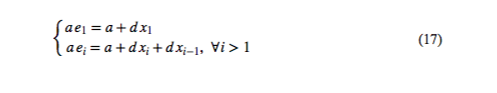
As it has been previously mentioned, the actual movement amplitude (ae) is calculated as follows:
For serial responses, which is the case of the multi-directional point-select test, each trial begins with the selection point of the previous trial. Therefore, an additional adjustment for ae is to add dx from the previous trial (for all trials after the first):
As a demonstration for the calculation of the a, b, c, dx, and ae values, the Table 2 presents the data corresponding to the sequence of trials of the participant P01 for the condition A= 1040 px, W = 130 px.
Table 2. Gathered data for the sequence of trials of the participant P01 for the condition A = 1040, W = 130
|
Trial |
From |
To |
Select |
MT (s) |
a (px) |
b (px) |
c (px) |
dx (px) |
ae (px) |
|||
|
x (px) |
y (px) |
x (px) |
y (px) |
x (px) |
y (px) |
|||||||
|
1 |
768 |
504 |
768 |
1544 |
764 |
1596 |
1.18 |
1040.00 |
52.15 |
1092.01 |
52.00 |
1092.00 |
|
2 |
768 |
1544 |
928 |
528 |
954 |
558 |
2.66 |
1028.52 |
39.70 |
1003.39 |
-25.59 |
1054.93 |
|
3 |
928 |
528 |
606 |
1518 |
690 |
1494 |
1.39 |
1041.05 |
87.36 |
994.89 |
-48.80 |
966.65 |
|
4 |
606 |
1518 |
1072 |
602 |
1104 |
624 |
1.16 |
1027.72 |
38.83 |
1023.35 |
-5.10 |
973.82 |
|
5 |
1072 |
602 |
462 |
1444 |
498 |
1418 |
2.64 |
1039.74 |
44.41 |
997.66 |
-42.18 |
992.47 |
|
6 |
462 |
1444 |
1188 |
718 |
1198 |
838 |
1.41 |
1026.72 |
120.42 |
953.38 |
-77.78 |
906.76 |
|
7 |
1188 |
718 |
346 |
1328 |
390 |
1370 |
2.03 |
1039.74 |
60.83 |
1030.49 |
-10.99 |
950.97 |
|
8 |
346 |
1328 |
1262 |
862 |
1198 |
894 |
1.86 |
1027.72 |
71.55 |
956.17 |
-71.55 |
945.18 |
|
9 |
1262 |
862 |
272 |
1184 |
326 |
1096 |
1.64 |
1041.05 |
103.25 |
964.81 |
-78.57 |
890.93 |
|
10 |
272 |
1184 |
1288 |
1024 |
1278 |
1096 |
1.74 |
1028.52 |
72.69 |
1009.84 |
-21.08 |
928.87 |
|
11 |
1288 |
1024 |
248 |
1024 |
260 |
1080 |
1.48 |
1040.00 |
57.27 |
1029.52 |
-12.00 |
1006.92 |
|
12 |
248 |
1024 |
1262 |
1184 |
1354 |
1164 |
1.41 |
1026.55 |
94.15 |
1114.83 |
87.76 |
1102.30 |
|
13 |
1262 |
1184 |
272 |
862 |
320 |
862 |
3.46 |
1041.05 |
48.00 |
995.51 |
-45.65 |
1083.16 |
|
14 |
272 |
862 |
1188 |
1328 |
1192 |
1364 |
1.85 |
1027.72 |
36.22 |
1048.05 |
19.89 |
1001.96 |
|
15 |
1188 |
1328 |
346 |
718 |
362 |
704 |
2.01 |
1039.74 |
21.26 |
1035.21 |
-4.74 |
1054.89 |
|
16 |
346 |
718 |
1072 |
1444 |
1016 |
1476 |
2.44 |
1026.72 |
64.50 |
1011.66 |
-16.97 |
1005.01 |
|
17 |
1072 |
1444 |
462 |
602 |
416 |
520 |
0.99 |
1039.74 |
94.02 |
1133.19 |
93.39 |
1116.16 |
|
18 |
462 |
602 |
928 |
1518 |
898 |
1476 |
3.03 |
1027.72 |
51.61 |
976.71 |
-51.04 |
1070.08 |
|
19 |
928 |
1518 |
606 |
528 |
722 |
640 |
1.51 |
1041.05 |
161.25 |
901.84 |
-142.39 |
847.63 |
|
20 |
606 |
528 |
768 |
1544 |
776 |
1492 |
2.04 |
1028.83 |
52.61 |
978.87 |
-50.09 |
836.36 |
|
21 |
768 |
1544 |
768 |
504 |
762 |
492 |
1.31 |
1040.00 |
13.42 |
1052.02 |
12.00 |
1001.91 |
|
Mean |
1.87 |
|
|
|
|
991.85 |
||||||
The calculations of the a, b, c, dx, and ae values that correspond to the first two trials are presented below (see Table 3).
Table 3. Calculations of the a, b, c, dx, ae values for the trials 1 and 2 in the P01 sequence of trials for the condition A = 1040, W = 130. (See for coordinate data).
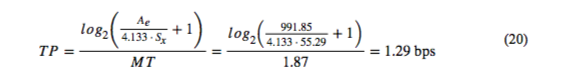
Given a sequence of trials, Ae is the mean of the ae values and SDx is the standard deviation in the dx values:
With these, throughput (TP) is computed using Equation 5:
Table 4 presents the values of throughput for each participant and for each condition (i.e., for each sequence of trials).
Table 4. Values of throughput for each sequence of trials
|
Participant |
Sequence of trials |
Condition |
TP |
Participant |
Sequence of trials |
Condition |
TP |
||
|
A |
W |
A |
W |
||||||
|
P01 |
1 |
1040 |
130 |
1.29 |
P02 |
1 |
260 |
260 |
1.26 |
|
|
2 |
520 |
260 |
1.74 |
|
2 |
520 |
260 |
1.11 |
|
|
3 |
260 |
130 |
1.04 |
|
3 |
1040 |
260 |
1.20 |
|
|
4 |
520 |
130 |
1.37 |
|
4 |
1040 |
130 |
1.30 |
|
|
5 |
260 |
260 |
1.05 |
|
5 |
520 |
130 |
1.52 |
|
|
6 |
1040 |
260 |
2.01 |
|
6 |
260 |
130 |
1.38 |
|
P03 |
1 |
260 |
130 |
1.52 |
P04 |
1 |
520 |
260 |
2.12 |
|
|
2 |
1040 |
130 |
1.14 |
|
2 |
1040 |
130 |
1.64 |
|
|
3 |
520 |
260 |
1.69 |
|
3 |
520 |
130 |
1.52 |
|
|
4 |
520 |
130 |
1.48 |
|
4 |
1040 |
260 |
1.54 |
|
|
5 |
1040 |
260 |
1.39 |
|
5 |
260 |
260 |
1.81 |
|
|
6 |
260 |
260 |
1.03 |
|
6 |
260 |
130 |
1.51 |
|
P05 |
1 |
1040 |
260 |
0.68 |
P06 |
1 |
260 |
260 |
2.05 |
|
|
2 |
260 |
260 |
1.40 |
|
2 |
1040 |
260 |
1.43 |
|
|
3 |
520 |
260 |
1.70 |
|
3 |
520 |
130 |
1.48 |
|
|
4 |
1040 |
130 |
1.05 |
|
4 |
520 |
260 |
2.28 |
|
|
5 |
520 |
130 |
1.71 |
|
5 |
260 |
130 |
2.47 |
|
|
6 |
260 |
130 |
1.39 |
|
6 |
1040 |
130 |
1.29 |
|
P07 |
1 |
1040 |
130 |
1.55 |
P08 |
1 |
260 |
260 |
1.77 |
|
|
2 |
520 |
130 |
0.81 |
|
2 |
520 |
130 |
1.13 |
|
|
3 |
520 |
260 |
1.76 |
|
3 |
520 |
260 |
1.74 |
|
|
4 |
1040 |
260 |
1.63 |
|
4 |
260 |
130 |
1.16 |
|
|
5 |
260 |
260 |
0.84 |
|
5 |
1040 |
260 |
1.85 |
|
|
6 |
260 |
130 |
1.90 |
|
6 |
1040 |
130 |
1.37 |
|
P09 |
1 |
260 |
260 |
1.55 |
P10 |
1 |
1040 |
260 |
1.60 |
|
|
2 |
260 |
130 |
1.59 |
|
2 |
520 |
130 |
1.49 |
|
|
3 |
1040 |
260 |
1.85 |
|
3 |
1040 |
130 |
1.33 |
|
|
4 |
520 |
130 |
1.65 |
|
4 |
260 |
260 |
1.29 |
|
|
5 |
520 |
260 |
1.46 |
|
5 |
260 |
130 |
1.16 |
|
|
6 |
1040 |
130 |
1.61 |
|
6 |
520 |
260 |
1.99 |
|
P11 |
1 |
1040 |
260 |
1.44 |
P12 |
1 |
520 |
130 |
1.20 |
|
|
2 |
260 |
130 |
0.83 |
|
2 |
260 |
260 |
1.01 |
|
|
3 |
520 |
130 |
1.17 |
|
3 |
1040 |
260 |
1.77 |
|
|
4 |
1040 |
130 |
1.32 |
|
4 |
1040 |
130 |
1.55 |
|
|
5 |
520 |
260 |
1.14 |
|
5 |
520 |
260 |
1.29 |
|
|
6 |
260 |
260 |
0.82 |
|
6 |
260 |
130 |
0.45 |
Given the values of throughput for each sequence of trials, the mean throughput is calculated as follows:
3. Related work
Below we provide two detailed examples of the inconsistency in the calculation of throughput. We focus specifically on experimental design issues that affect the calculation of throughput.
Perry and Hourcade [7] analyzed one-handed thumb tapping on mobile touchscreen devices. The study included five different target sizes and 25 unique positions that intersect a four-by-four grid which divided the screen of the mobile device. They used a custom task for the experiment, where every combination of position (25 unique positions) and size (five different target sizes) appeared randomly for each sub-block (two sub-blocks). The initial target was positioned below the targets, unless the destination target was located in the two rows located on the bottom of the four-by-four grid. In this case, the initial target was above the destination target. The start target was always positioned 27.9 mm away from the destination target. With this custom task, the amplitude remains constant within all the trials (A = 27.9 mm) and the target width (W) varies from trial to trial within each sequence of trials. They calculated the index of performance (throughput) using the index of difficulty (ID) instead of the effective index of difficulty (IDe) applying the formula TP=ID/MT. Thus, the measure does not embed the accuracy of users’ responses. They reported a throughput around 4 bps.
Henze and Boll [8] analyzed the touch screen behavior for smartphones using the game Hit It!, published on Android Play Store. They designed part of the game as a Fitts’ law task. Multiple circles of different sizes were displayed and the player sequentially touched the targets. As soon as one target was successfully touched, it disappeared. The player must touch all targets in a certain timeframe. The game was lost if the timeframe expired or if the player missed three targets. When the player touched the first circle, the touched position and the current time were used as the starting time of the first task. Amplitude (A) was the distance from the position of the first touch to the center of the second circle and width (W) was the diameter of the second circle. With this custom task, A and W were not constant within each sequence of trials. To apply Fitts’ law, they computed the least-squares prediction equation as
and calculated throughput as 1/b. They reported an implausibly high value for throughput in the range of 16 to 25 bps. As the prediction equation had low correlation, they argued that the high throughput suggests that the task might be different from what is commonly used as a Fitts’ law task (recommended by ISO 9241-411) and the low correlation shows that Fitts’ law is not a good model for the tasks employed.
The two studies that were preciously quoted are examples of the various ways in which throughput is calculated within the Fitts’ law literature. Although numerous other examples exist, space precludes a detailed review. In the following section, we present an example of a user study where a non-ISO point-select task was used. We then examine issues concerning the calculation of throughput.
4. The “Face Me” experiment
The “Face Me” experiment used a mobile head-tracking interface to investigate the effect of device orientation (portrait, landscape), gain (1.0, 1.5), and target width (88 pixels, 176 px, 212 px). In the initial poster [9], the evaluation was limited to selection accuracy, cursor velocity, and selection errors.
4.1 Participants
Nineteen unpaid participants (four females) were recruited from the local town and university campus from an age group from 23 to 69 years old. The average age was 38.2 years (SD = 14.1). None of the participants had previous experience with head-tracking interfaces.
4.2 Apparatus and Experiment Task
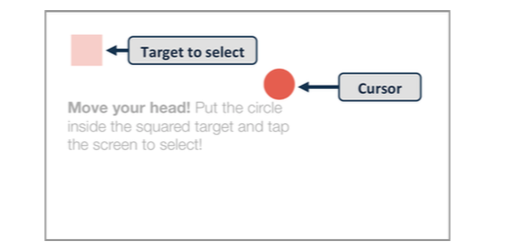
The experiment was conducted using an iPhone 5 with a resolution of 640 × 1136 px and a pixel density of 326 ppi. This corresponds to a resolution of 320 × 568 Apple points. The experiment involved a point-select task that required positioning a circle cursor inside a square target (see Figure 4 ).
Figure 4. Example of a target condition (W = 88 px, orientation = landscape) with annotations and the procedure instructions (task belonging to the practice sequence).
User input combined mobile head-tracking for pointing and touch for selection. In order to start the trial, the user could select by tapping anywhere on the display surface with a thumb. The target was highlighted in green when the center of the cursor was inside the target; a selection performed in these conditions was considered successful.
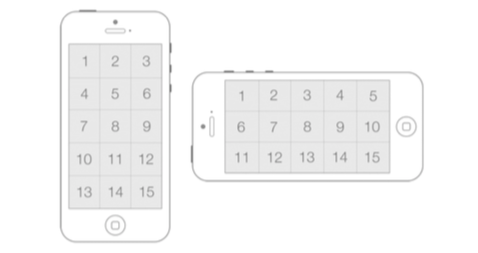
The experiment sought to determine if all regions of the device screen were accessible for users. For this purpose, the display surface was divided into 15 regions of approximately 213 × 227 px (see Figure 5). The targets were centered inside the regions.
Figure 5. Regions of the display surface in portrait and landscape orientation. (Numbers added to identify regions).
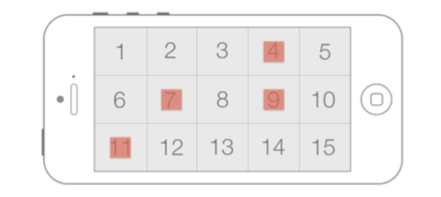
The task was implemented in both portrait and landscape (right) orientations. A sequence of trials consisted of 15 target selections, one for each of the 15 regions of the display, presented randomly and without replacement. Upon selection, a new target appeared centered inside one of the remaining regions. Selections proceeded until all 15 regions of the display were used as target centers (see Figure 6).
Figure 6. Random example of the first four trials of a possible sequence of trials with targets placed inside their regions (selection order: 7, 9, 4, 11) of a target condition (W = 88 px, orientation = landscape). Note that only one target is visible for each trial (numbered regions and already selected targets added for clarification purposes).
According to the iOS Human Interface Guidelines [10], the optimal size of a tappable UI element on the iPhone is 44 × 44 pt, which is equivalent to the minimum level chosen for target width: 88 × 88 px. The maximum level for target width was limited by the size of the screen regions (approximately 213 × 227 px).
For each user session, all 12 conditions were used and presented in random order until all trials were completed. In order to adapt to each new condition, participants were required to correctly select a practice series of three targets to start the sequence of trials (see Figure 7). The practice series was not registered as experiment data.
Figure 7. Example of the practice sequence for the target condition.
4.3 Procedure
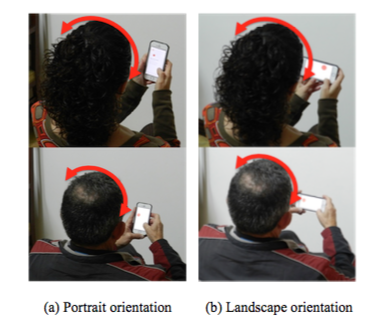
After signing a consent form, participants were briefed on the goals of the experiment and were instructed to sit and hold the device (in the orientation indicated by the software) in a comfortable position (see Figure 8). The only requirement was that their entire face was entirely visible to the device’s camera.
Figure 8. Participants performing the experiment: holding the device in (a) portrait orientation and in (b) landscape orientation. Moving the cursor by moving the head and selection by tapping anywhere on the display surface with a thumb.
The experiment task was shown to participants. After that, they did a few practice sequences. They were instructed to move the cursor by holding the device still and moving their head. Participants were asked to select targets as quickly and as close to the center as possible. They were allowed to rest as needed between sequences. Testing took around 15 minutes per participant.
4.4 Design
The experiment was entirely within-subjects and it had the following independent variables and levels:
The total number of trials was 19 Participants × 2 Orientations × 2 Gains × 3 Widths × 15 Trials = 3420.
A detailed description of the “Face Me” experiment and the results obtained is found elsewhere [9].
5. Fitts’ law analysis (“Face Me” experiment data)
The “Face Me” experiment was not initially conceived for Fitts’ law analysis. But, as the study involved point-select movements over a range of amplitudes and target widths, it may be possible to calculate throughput with the experiment data. This is examined below.
A sequence of trials was composed of 15 target selections. Each one of the targets had same width, but appeared in a random region of the displace surface. Therefore, target width (W) was constant within each sequence of trials, but amplitude (A) varied.
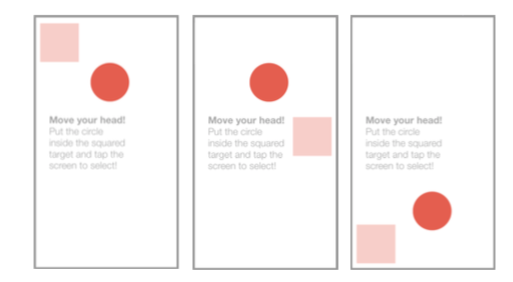
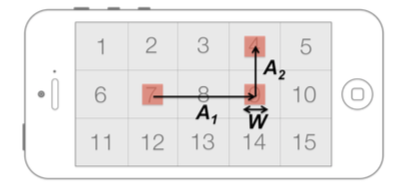
To apply Fitts’ law to the “Face Me” task, we defined for each trial “W” as the width of the current target, “MT” as the time between selection of the previous target with the selection of the current one, and A as the distance from the center of the previous target to the center of the current target (see Figure 9). We considered the time when the first target was selected as the beginning of the sequence; therefore, the first target of every sequence was discarded for the analysis.
Figure 9. Definition of A and W for a random example of the first three trials of a possible sequence of trials (selection order: 7, 9, 4) for a target condition (W = 88 px, orientation = landscape).
The sequential appearance of targets in random regions creates two main issues for the calculation of throughput:
Further methods to correct and adapt these issues are explored below.
5.1 Reaction Time
Fitts’ law is a model for point-select movement tasks. The task should not involve a reaction time or, if it does, the reaction time should be excluded from the task completion time [11]. For the “Face Me” experiment task, each target was randomly positioned and appeared only when the preceding target was selected. Thus, the task likely included a reaction time component. Arguably, this should be removed from the task completion time. It is known that the time to react to a visual stimulus is about 200 ms [12, p. 41]. Thus, one way to remove reaction time for the “Face Me” task is to reduce the movement time for each trial by about 200 ms. The effect of doing so is included in our discussions of issue #2.
5.2 Non-constant Amplitude
Since targets were randomly positioned for each trial in the “Face Me” task, the amplitude of movements varied from trial to trial. The amplitude might be small (e.g., neighboring targets) or large (e.g., targets on opposite corners of the display surface). To overcome the non-constant amplitude issue, we explored two methods of trial aggregation: (1) aggregation by trial sequence with A equal to the mean amplitude of movement over the trials in the sequence and (2) aggregation by common A-W conditions. Each of these methods are examined below.
5.2.1 Aggregation by Sequence
Using this approach, we calculated throughput within each sequence of trials defining A as the average amplitude for all trials in the sequence.
After discarding the first trial, a sequence of trials was formed by 14 target selections. For each of the 19 participants, we had 12 sequences of trials (one sequence per condition). Therefore, we had 228 sequences of trials (19 Participants × 2 Orientations × 2 Gains × 3 Widths). Although we had potentially 228 different but very similar amplitudes, it makes no sense to construct a Fitts’ law regression model, as the index of difficulties are the same or similar.
Since the standard deviations of the selection coordinates were available, we calculated We using the standard deviation method (Equation 3). The grand mean for throughput using IDe was 0.78 bps (see Table 5). By orientation, the means were 0.79 bps (portrait) and 0.77 bps (landscape). The difference was not statistically significant (F1,18 = 0.43, ns). By gain, the means were 0.82 bps (1.0) and 0.75 bps (1.5). The difference was statistically significant (F1,18 = 9.19, p < .01).
Table 5. Aggregation by sequence of trials: comparison of throughputs.
|
Condition |
Throughput (bps) |
|
|
ID / MT |
IDe / MT |
|
|
Portrait (gain = 1.0) |
0.90 |
0.82 |
|
Portrait (gain = 1.5) |
0.89 |
0.77 |
|
Landscape (gain = 1.0) |
0.89 |
0.82 |
|
Landscape (gain = 1.5) |
0.92 |
0.73 |
|
Mean |
0.90 |
0.78 |
The grand mean for throughput using ID was 0.90 bps. For both independent variables (orientation, gain), the difference between the means was not statistically significant (ns). If we reduce the movement time by 200 ms for each trial to remove reaction time (see Section 5.1), throughput increases by about 10 %, to 0.87 bps (or to 1.00 bps without using effective values).
Regression models were not built using the aggregation by sequence approach. The reason, as noted above, is that the IDs were all the same, or similar, since the amplitude for each sequence was the mean amplitude computed across the trials in the sequence.
5.2.2 Aggregation by A-W Condition
Using this approach, we calculated throughput across sequences of trials by adding equivalent A-W conditions. The randomization of target positions yielded a large number of different amplitudes, which was worsened by the slightly off-square size of the original display regions (213 × 227 px).
To achieve a practical number of index of difficulty conditions and because the aspect ratio of the display regions was close to 1, we adjusted the task amplitudes according to the number of regions between the start and end targets, instead of the difference in coordinates. Therefore, we considered an adjusted squared region size of 220 × 220 px (220 px = average size of the two dimensions of the original region), so that the adjusted amplitude between the start and end targets separated by the same number of regions was equivalent. As an example, and as reference to Figure 5, a task between regions 8 and 3 in landscape orientation (vertical movement difference in regions = 1) had an original amplitude of 213 px that was adjusted to an amplitude of 220 px (new region dimension × 1). For a task between regions 11 and 12 in landscape orientation (horizontal movement, difference in regions = 1), the original amplitude was 227 px, which is different from the amplitude of the vertical movement across region; but, with the adjusted amplitude (220 px), both tasks had the same amplitude value (see Table 6).
Table 6. Examples of amplitudes and adjusted amplitudes (see Figure 5 for region identification)
|
Orientation |
Target region |
Difference |
Amplitude (px) |
||
|
Start |
End |
Original |
Adjusted |
||
|
Landscape |
8 |
3 |
1 |
213 |
220 |
|
Landscape |
11 |
12 |
1 |
227 |
220 |
|
Landscape |
7 |
9 |
2 |
454 |
440 |
|
Landscape |
12 |
2 |
2 |
426 |
440 |
With the adjustment, there were 11 different amplitudes. Therefore, the number of index of difficulty conditions was 33 (11 Amplitudes × 3 Widths). Consequently, aggregation by A-W condition produced 33 A-W conditions, each with a different number of trials and from different participants.
The trials that accomplished the A-W condition, were formed by tasks from different participants. It made no sense to calculate We using the standard deviation method; instead, We was calculated using the discrete error method. See Equation 4.
The grand mean for throughput was 0.70 bps using IDe and 0.87 bps using ID (see Table 7). In both cases and for both independent variables (orientation, gain), the difference between the means was not statistically significant.
Table 7. Aggregation by A-W condition: comparison of regression models and throughputs
|
Condition |
MT-ID regression |
MT-IDe regression |
Throughput (bps) |
|||||||
|
a (s) |
b (s/bit) |
R2 |
a (s) |
b (s/bit) |
R2 |
1/b (MT-ID) |
1/b (MT-IDe) |
ID/MT |
IDe/MT |
|
|
Portrait (gain = 1.0) |
0.52 |
0.97 |
0.74 |
1.37 |
0.72 |
0.50 |
1.03 |
1.39 |
0.85 |
0.71 |
|
Portrait (gain = 1.5) |
0.04 |
1.18 |
0.70 |
1.65 |
0.64 |
0.20 |
0.85 |
1.56 |
0.86 |
0.68 |
|
Landscape (gain = 1.0) |
1.22 |
0.62 |
0.43 |
1.98 |
0.38 |
0.18 |
1.61 |
2.63 |
0.88 |
0.70 |
|
Landscape (gain = 1.5) |
0.68 |
0.86 |
0.50 |
1.94 |
0.41 |
0.17 |
1.16 |
2.44 |
0.89 |
0.70 |
|
Mean |
1.16 |
2.00 |
0.87 |
0.70 |
||||||
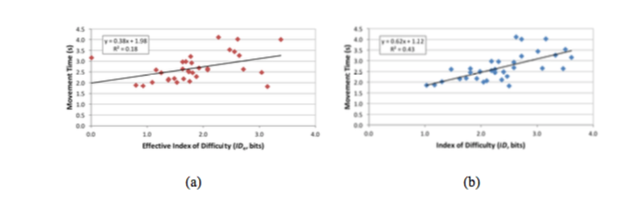
We constructed two Fitts’ law regression models for each of the four experiment conditions (2 Orientations × 2 Gains) by using the 33 combinations of movement amplitudes and target widths. One model used the effective index of difficulty (IDe) and the other used the presented index of difficulty (ID). As a matter of demonstration, throughput was also calculated as 1/b from the regression equations. See Table 7. Note that for all eight models, throughput was calculated using 1/b (columns 8 and 9), which it is higher than throughput calculated using the division of means (columns 10 and 11). This is due to the presence of a positive intercept in the models. A positive intercept lowers the slope coefficient (b) and hence increases 1/b. Note also in right two columns (10 and 11) that throughput is lower when computed using IDe versus ID. This occurs because the IDe values overall were lower than the ID values (see Figure 10). With a lower numerator, the quotient (throughput) is naturally lower.
Figure 10. Regression models for the experiment condition orientation = landscape, gain = 1. (a) Using IDe and (b) using ID. See text for discussion on the left-most point in (a).
As mentioned above, each A-W condition had different number of trials. The variation in the number of trials could produce a bias. In particular, sequences with low number of trials have disproportionately high-influence, both in calculating the mean over A-W conditions and in building a regression model. As an example, Figure 10 shows the two scatter plots and regression models for the experiment condition orientation = landscape, gain = 1.0. Apart from the low correlation in both models, an extreme case appears for the condition A = 492.8 px and W = 44 px (Only two trials had this A and W combination). What is more, both trials resulted in errors, since IDe was close to 0. This can be seen at the leftmost point in Figure 10a. As in the previous approach, the values of throughput could be recalculated by removing the reaction time from the movement time. This had a similar effect on increasing the throughput values by about 10 %.
6. Discussion
In the previous sections, two methods of aggregation were applied to overcome the non-constant amplitude for calculating throughput: aggregation by sequence and aggregation by A-W condition.
For the aggregation by sequence case (see Table 8, first row), throughput was calculated in two different ways:
Table 8. Summary of four methods for calculating throughput (bps) by aggregation method
|
Method |
1/b |
Division of means |
||
|
ID |
IDe |
ID |
IDe |
|
|
Aggregation by sequence |
- |
- |
0.90 |
0.78 |
|
Aggregation by A-W |
1.16 |
2.00 |
0.87 |
0.70 |
|
Mean |
0.89 |
0.74 |
||
For the aggregation by A-W condition case (see Table 8, second row), throughput was calculated in four different ways:
Although these different calculations (and others) are all represented in the Fitts’ law literature, the values in the right-hand column in Table 5, Table 7, and Table 8 are the most realistic. They were computed both using the division of means and using the effective value for the index of difficulty (to include accuracy). This is the method of calculation stipulated in ISO 9241-411 (see also [3] for further discussion on the calculation of throughput).
As noted earlier, the interpretation of throughput as the slope reciprocal should be avoided because it does not fit within the original definition given by Fitts, and also because of the wavering influence of the intercept. In Table 7, the effect of the intercept (a) on throughput is visible not only when using the division of means but also when using the slope reciprocal. In cases where the intercept is close to 0, both values are similar (see Table 7 row: portrait (gain = 1.5) columns: 2, 8, and 10). As the intercept increases, the difference between values also increases (see Table 7 row: landscape (gain = 1.0) columns: 2, 8, and 10). Therefore, we focused on throughput calculated using the division of means.
For both methods of aggregation, the throughput values were higher when calculated using ID compared to IDe. The increases were of 15 % by sequence case and of 25 % by A-W condition case. This occurred because participants made an overall of > 4 % errors (with a corresponding increase in SDx). Thus, the IDe values were slightly lower than the ID values, which means that this IDe lower value tends to decrease throughput results when computed using the division of means. In summary, throughput calculated including the adjustment for accuracy is the most realistic approach because it embeds both the speed and accuracy in human responses. Therefore, the calculation of throughput should use the effective values whenever possible.
Since the “Face Me” experiment evaluated a novel head-tracking interaction method and that there was a specific motivation to test target selection over the entire display surface, the “Face Me” experiment did not use tasks following ISO 9241-411. The grand mean for throughput using the non-ISO task was 0.74 bps (or around 0.81 bps if throughput is recalculated by removing the reaction time from the movement time). This value is low compared to the value of throughput, which is 1.42 bps, and it was obtained using the same head-tracking interaction method of the ISO task [13]. The increase of throughput using the ISO task together with the low correlation values obtained in the regression models may suggest that the “Face Me” task is ill-suited for the evaluation of Fitts’ law performance.
The “Face Me” task presented two main issues for the evaluation of Fitts’ law performance: (1) reaction time was included in the movement time and (2) the amplitude varied within each sequence of trials. These two issues resulted from the sequential appearance of targets in random regions. We now present design recommendations for non-ISO tasks used in the evaluation of Fitts’ law performance.
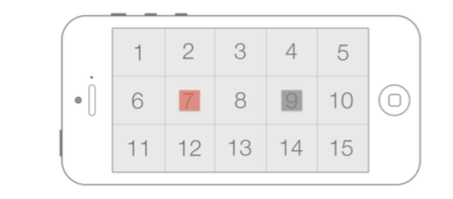
Figure 11. Example of dimly highlighting the target to select following target to avoid reaction time. Target to select = 7, next target to select = 9 (highlighted in gray).
7. Conclusion
We presented the “Face Me” experiment, which evaluated a novel head-tracking interaction method with a specific motivation to test target selection over an entire display surface. Therefore, the “Face Me” experiment did not use tasks following ISO 9241-411. Despite using a non-ISO task, we evaluated Fitts’ law performance using the “Face Me” experiment data, trying to overcome the challenges brought forth by the custom task. In addition, we detailed the calculation of throughput.
We recommend calculating throughput using the division of means and with the adjustment for accuracy. The latter grounded on the benefits of including spatial variability in human responses. The grand mean for throughput was 0.74 bps, which is 45 % lower than the value obtained using an ISO task. We conclude that the low value of throughput, together with the low correlation values obtained in the regression models, may suggest that the “Face Me” task was ill-suited for the Fitts’ law performance evaluation.
Hence, we presented design recommendations for non-ISO tasks such as: Keeping amplitude and target width constant within each sequence of trials and using strategies that avoid or remove reaction time.
Acknowledgments
This work has been partially supported by the project TIN2016-81143-R (AEI/FEDER UE) grant BES-2013-064652 (FPI) and mobility grant EEBB-I-15-10293. Finally, we also acknowledge the support of the “Visiting lecturers on short visits” programmed by the OSR (University of Balearic Islands).
References
[1] P. M. Fitts, “The information capacity of the human motor system in controlling the amplitude of movement,” J. Exp. Psychol., vol. 47, no. 6, p. 381, 1954.
[2] I. S. MacKenzie, “Fitts’ law as a research and design tool in human-computer interaction,” Human-Computer Interact., vol. 7, no. 1, pp. 91–139, 1992.
[3] R. W. Soukoreff and I. S. MacKenzie, “Towards a standard for pointing device evaluation, perspectives on 27 years of Fitts’ law research in HCI,” Int. J. Hum. Comput. Stud., vol. 61, no. 6, pp. 751–789, Dec. 2004.
[4] ISO, “9241--9. 2000. Ergonomics requirements for office work with visual display terminals (VDTs) -- Part 9: Requirements for non-keyboard input devices,” Int. Organ. Stand., 2002.
[5] ISO, “9241--411. 2012. Ergonomics of human-system interaction -- Part 411: Evaluation methods for the design of physical input devices,” Int. Organ. Stand., 2012.
[6] I. S. MacKenzie, “Fitts’ throughput and the remarkable case of touch-based target selection,” in Proceedings of the 17th International Conference on Human-Computer Interaction - HCII 2015, 2015, pp. 238–249.
[7] K. B. Perry and J. P. Hourcade, “Evaluating one handed thumb tapping on mobile touchscreen devices,” in Proceedings of the Graphics Interface 2008 - GI 2008, 2008, pp. 57–64.
[8] N. Henze and S. Boll, “It does not Fitts my data! Analysing large amounts of mobile touch data,” in Proceedings of the IFIP Conference on Human-Computer Interaction - INTERACT 2011, 2011, pp. 564–567.
[9] M. F. Roig-Maimó, J. Varona Gómez, and C. Manresa-Yee, “Face Me! Head-Tracker Interface Evaluation on Mobile Devices,” in Proceedings of the 33rd Annual ACM Conference Extended Abstracts on Human Factors in Computing Systems, 2015, pp. 1573–1578.
[10] Apple Inc, “iOS Human Interface Guidelines: Designing for iOS.” .
[11] P. M. Fitts and J. R. Peterson, “Information capacity of discrete motor responses.”
[12] R. W. Bailey, Human performance engineering: Designing high quality professional user interfaces for computer products, applications and systems, 3rd ed. Upper Saddle River, NJ: Prentice Hall, 1996.
[13] M. F. Roig-Maimó, I. S. MacKenzie, C. Manresa-Yee, and J. Varona, “Head-tracking interfaces on mobile devices: Evaluation using Fitts’ law and a new multi-directional corner task for small displays,” Int. J. Hum. Comput. Stud.
Maria Francesca Roig-Maimó
Received her degree in Computer Science and her Master degree in Computer Science from the University of Balearic Islands. She is currently a Ph. D. student and an Assistant Lecturer at the University of Balearic Islands. Her research interests include human-computer interaction, mainly focused on mobile devices and performance evaluation.
Scott MacKenzie
Researcher in human-computer interaction with an emphasis on human performance measurement and modeling, experimental methods and evaluation, interaction devices and techniques, text entry, touch-based input, language modeling, accessible computing, gaming, and mobile computing. He has more than 160 peer-reviewed publications in the field of Human-Computer Interaction and has given numerous invited talks over the past 25 years. In 2015, he was elected into the ACM SIGCHI Academy. Since 1999, he has been Associate Professor of Computer Science and Engineering at York University, Canada. Home page: http://www.yorku.ca/mack/
Cristina Manresa-Yee
Received her degree in Computer Science and her Ph. D. in Computer Science from the University of Balearic Islands. She is currently an Associate Professor at the University of the Balearic Islands. Her research interests include human-computer interaction, computer vision and assistive technologies. She is a member of the Asociación Interacción Persona-Ordenador (AIPO).
Javier Varona
Researcher in computer vision and machine learning for human computer interaction and human behavior analysis. He was researcher in the Computer Vision Centre (CVC) at the Universitat Autònoma de Barcelona. Since 2003, he is researcher at the Universitat de les Illes Balears (UIB), and from 2009, he is also Associate Professor in the Dept. of Mathematics and Computer Science. He has participated in over 20 funded research projects. He is the leader of a Spanish government funded research project on vision-based interaction in health contexts (TIN2016-81143-R).